

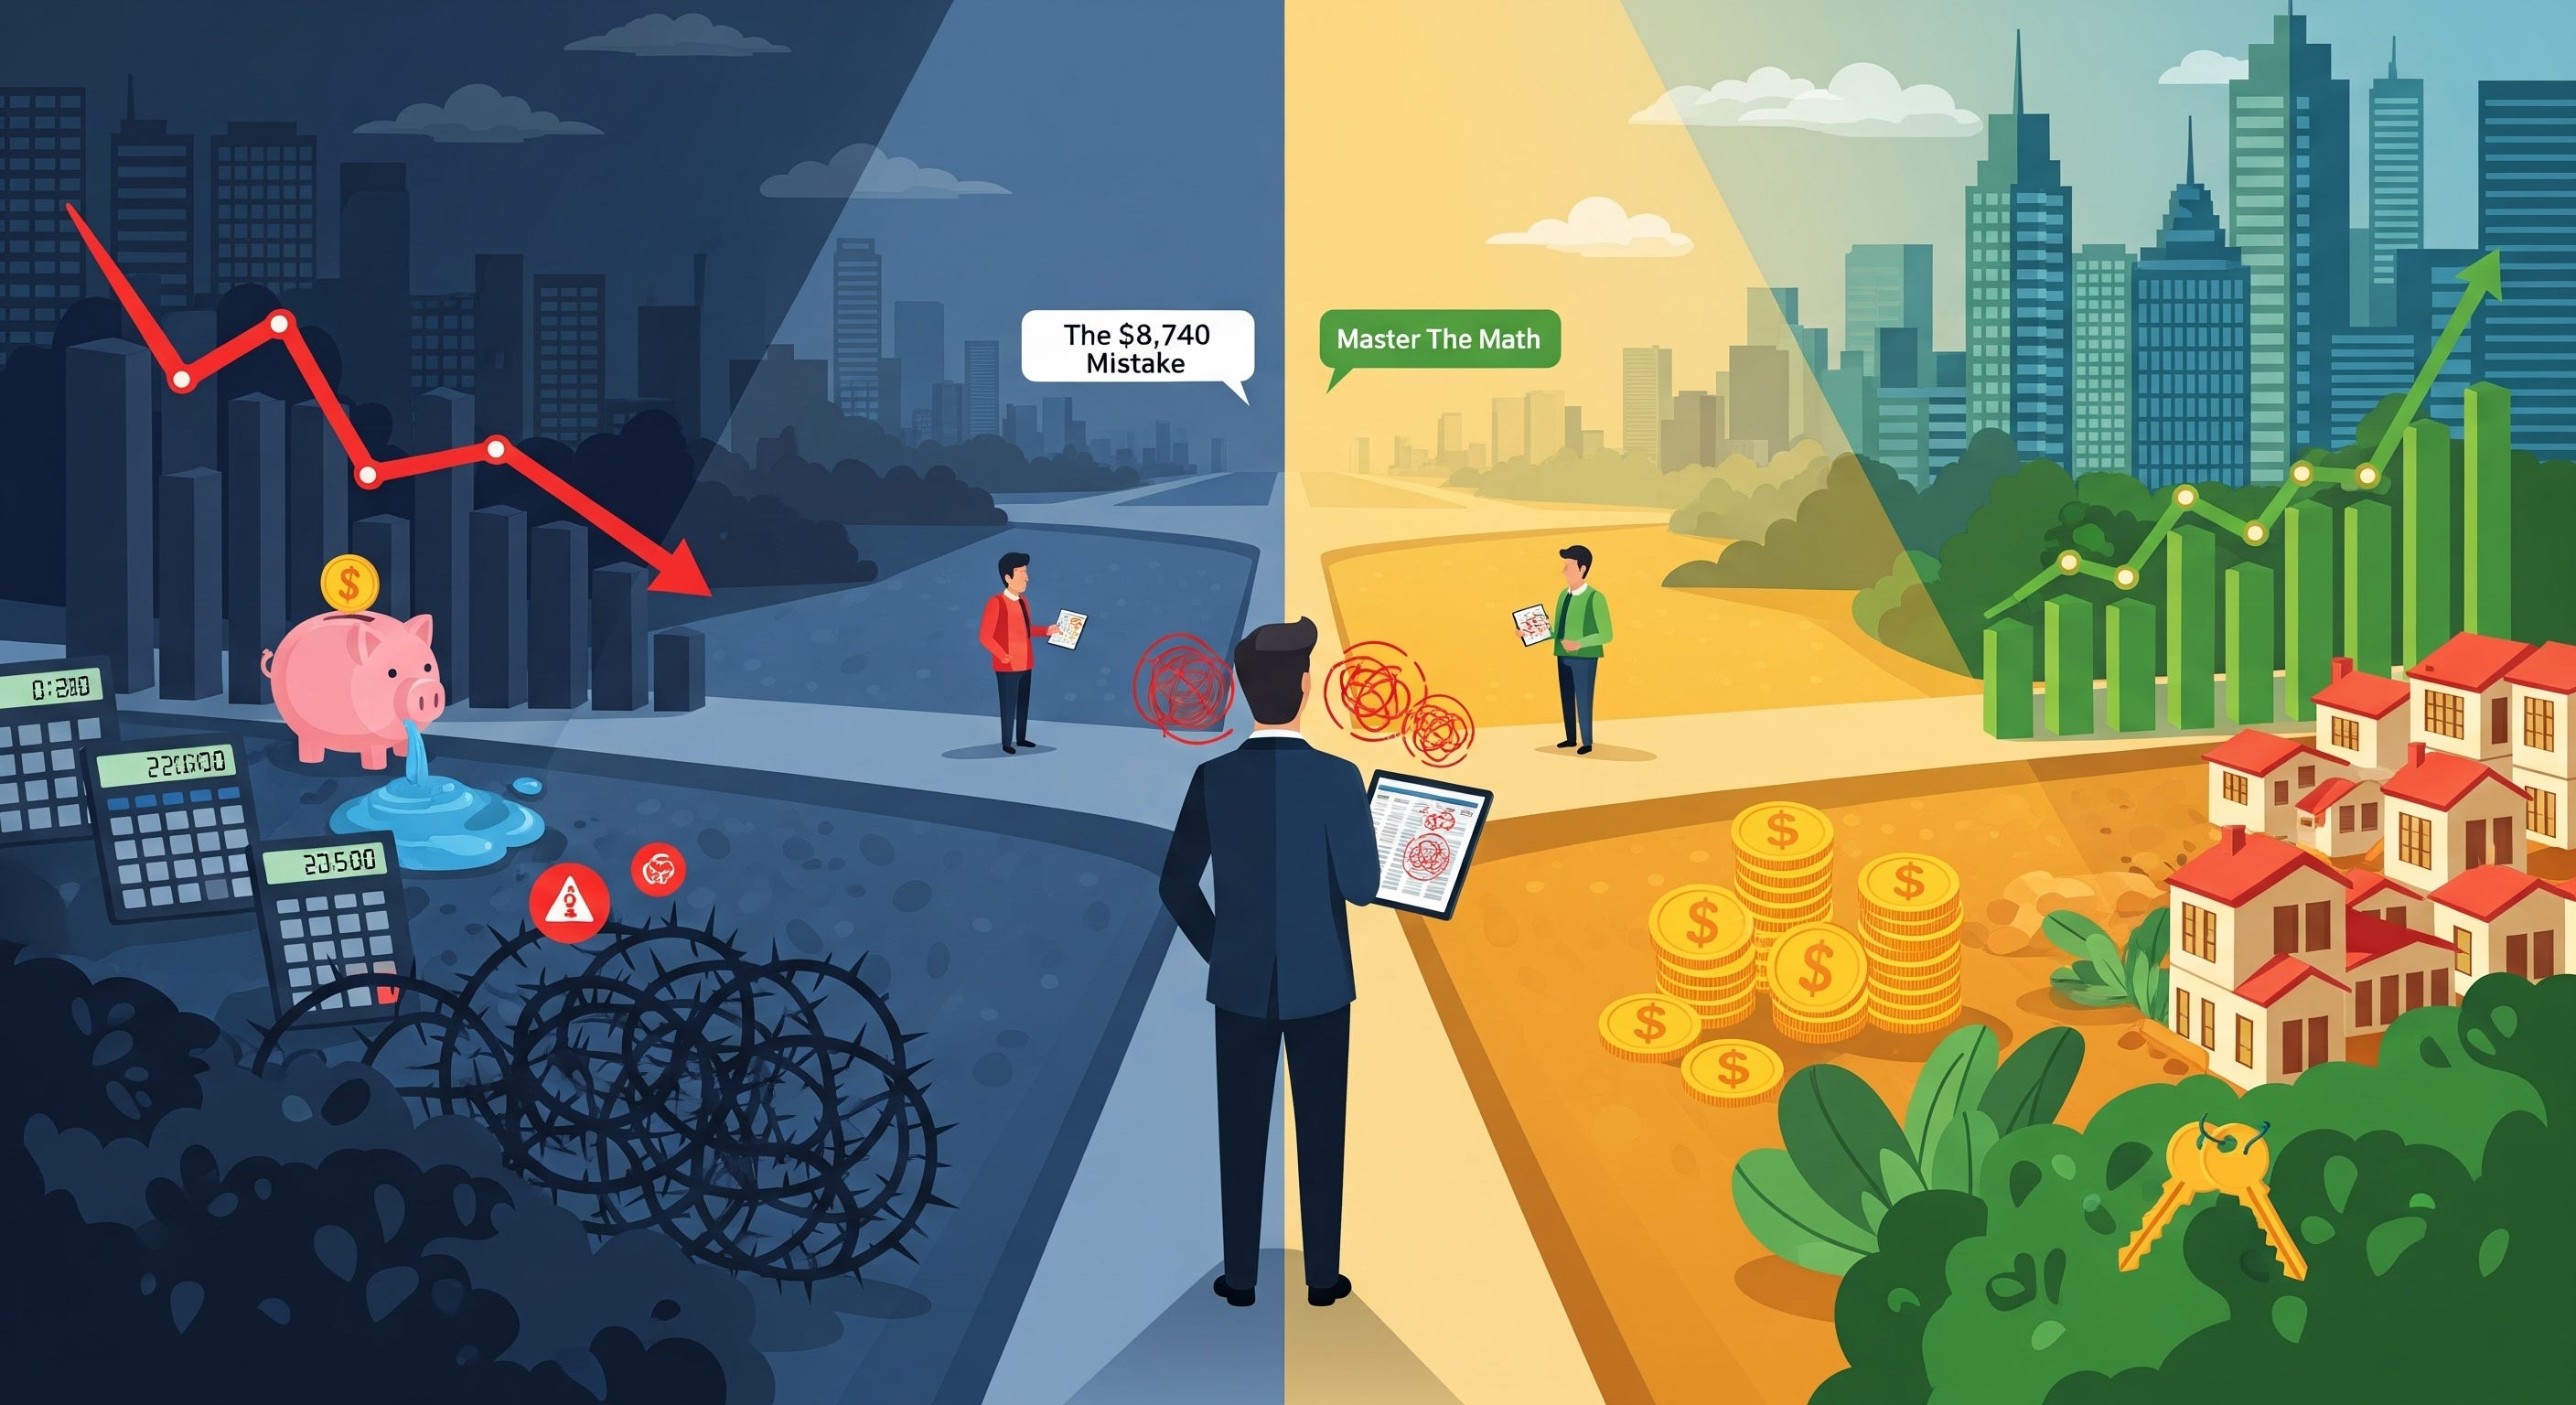
Why 99% of STR Hosts Are Bleeding Money (And Don't Even Know It)
The $6,416 mistake that proves most rental hosts can't do 6th grade math

Stop Pretending You Understand Your Own Business Numbers
I'm sitting in a contract negotiation for $64,000 right now. The other party just handed me paperwork claiming I owe $72,740.98. They're mathematically wrong. And their mistake could cost me thousands.
But here's what terrifies me about the short-term rental industry: Most hosts make this exact same type of mathematical error every single day with their properties.
You think you're profitable. You think you understand your numbers. But you're calculating occupancy rates wrong, pricing strategies incorrectly, and completely missing the mathematical relationships that determine whether you're building wealth or just breaking even.
"Mathematics is the language with which God has written the universe." - Galileo Galilei
The brutal truth? According to AirDNA's 2024 Market Report, 40% of STR hosts operate at a loss when you factor in true costs, yet they believe they're profitable because they can't properly calculate ROI, understand compound cash flow, or recognize when market data is telling them to pivot.
This isn't about being "good at math" or "bad at math." This is about financial survival in an industry where every booking, every expense, and every pricing decision has a mathematical formula attached.
Want to see exactly how mathematical precision translates to STR profitability? Book a strategy session here and I'll show you the 6 mathematical skills that separate profitable hosts from those slowly going broke.
Your "Profitable" STR Property Is Probably Losing Money (The Numbers Don't Lie)
Let me show you the exact contract dispute I'm dealing with, and then connect it to why most STR hosts are mathematically illiterate about their own businesses.
📋 THE CONTRACT FACTS:
Amount to repay:    $64,000
Down payment:      $10,000
Interest rate:      7% APR
Term:               54 months
Amortization:       Fully amortized
❌ THEIR FAULTY INTERPRETATION:
🔴 Total Settlement: $72,740.98
🔴 "Principal": $64,000
🔴 "Fixed Interest": $8,740.82
✅ MATHEMATICAL REALITY:
✓ Principal After Down Payment: $54,000
✓ Monthly Payment: $1,168.65
✓ Total Interest Over Life: $9,106.83
✓ Total Amount Paid: $63,106.83
✓ Their Overcharge: $9,634.15
Now let's connect this to YOUR STR business:
Most hosts make the same error with their property calculations. They look at gross revenue and think they understand profitability. They treat "total potential income" as "profit" without understanding the mathematical difference.
🚫 TYPICAL HOST CALCULATION:
Property Purchase Price = $300,000
Annual Gross Revenue = $45,000
─────────────────────────────────
"ROI" = $45,000 ÷ $300,000 = 15%
✅ MATHEMATICAL REALITY:
Property Purchase Price = $300,000
Down Payment (20%) = $60,000
Loan Amount = $240,000
Annual Gross Revenue = $45,000
Annual Expenses = $28,000
─────────────────────────────────
Net Cash Flow = $17,000
Actual ROI = $17,000 ÷ $60,000 = 28.3%
See the difference? The mathematical relationship between gross revenue, net profit, and return on actual investment completely changes your business decisions.
The 6 Mathematical Realities Destroying STR Host Profits
"Mathematics is not about numbers, equations, computations, or algorithms: it is about understanding." - William Paul Thurston
Here are the exact mathematical skills you need to run a profitable STR business. Not advanced calculus. These six fundamentals that 75% of hosts never properly implement:
1️⃣ True Occupancy Rate Calculations (Not Airbnb's Lies)
🚫 WRONG WAY (What Most Hosts Do):
Bookings ÷ Available Days = Occupancy Rate
   15    ÷     30        = 50% occupancy
✅ RIGHT WAY (Mathematical Reality):
Occupied Nights ÷ Available Nights = True Occupancy
      21        ÷       30         = 70% occupancy
💰 REVENUE IMPACT:
Calculation Method          Formula                    Result
─────────────────────────────────────────────────────────────
Wrong calculation:          $150/night × 15 bookings  $2,250
Right calculation:          $150/night × 21 nights    $3,150
Monthly difference:                                    +$900
2️⃣ Cost Per Acquisition (What Each Guest Actually Costs You)
📊 THE HIDDEN COSTS:
Monthly Marketing Spend = $1,200
Monthly Bookings = 8
─────────────────────────────────
Cost Per Booking = $150

BUT WAIT...
Average Booking Length = 3.2 nights
─────────────────────────────────
Cost Per Guest Night = $46.88
💡 PROFIT REALITY CHECK:
Average Nightly Rate = $180
Cost Per Guest Night = $46.88
─────────────────────────────────
True Profit Margin = $133.12 per night

Most hosts think profit = $180
(Missing the $46.88 acquisition cost!)
3️⃣ Dynamic Pricing Mathematics (Stop Guessing Your Rates)
🎯 BASE RATE CALCULATION:
Monthly Fixed Costs = $3,500
Target Occupancy = 70%
Available Nights = 30
Occupied Nights = 21

Break-Even Rate = $3,500 ÷ 21 = $166.67/night
Profit Target (30%) = $166.67 × 1.30 = $216.67/night
📈 SEASONAL ADJUSTMENTS:
Season              Multiplier           Rate
────────────────────────────────────────────────────
Peak Season:        $216.67 × 1.50      $325/night
Regular Season:     $216.67 × 1.00      $217/night
Off Season:         $216.67 × 0.80      $173/night
4️⃣ Cash-on-Cash Return (Your Real Investment Performance)
🏠 THE COMPARISON:
Property Value:             $400,000
Down Payment:              $80,000
Annual Cash Flow:          $22,400

CORRECT CALCULATION:       $22,400 ÷ $80,000 = 28%
WRONG CALCULATION:         $22,400 ÷ $400,000 = 5.6%
The difference? 28% looks like a great investment. 5.6% looks like you should sell and buy index funds.
5️⃣ Compound Cash Flow Projections (Why Time Matters)
📊 THE COMPOUNDING EFFECT:
Year 1: Monthly Cash Flow = $1,867
        Annual Cash Flow = $22,400

Year 1 Reinvestment: $22,400 into improvements
Revenue Increase: 15%

Year 2: Cash Flow = $22,400 × 1.15 = $25,760

Year 5 Projection:
$22,400 × (1.15)⁵ = $45,054 annual cash flow
Monthly = $3,755
⚡ THE POWER OF UNDERSTANDING:
But ONLY if you understand compound growth!
6️⃣ Exit Strategy Mathematics (When to Sell vs. Hold)
🔍 THE ANALYSIS:
Current Property Value:     $450,000
Annual Cash Flow:          $25,000
Net Sale Price:            $405,000 (after costs)

Hold Strategy:             $25,000 ÷ $450,000 = 5.56% return
Sell & Reinvest:           $405,000 × 8% = $32,400 annually

Mathematical Decision:     SELL
Additional Annual Income:  +$7,400/year
These calculations determine whether you build generational wealth or stay trapped in the "busy being busy" cycle that destroys 60% of STR businesses within 3 years.
Why Your "Profitable" Property Numbers Are Mathematical Fiction
Here's where most STR hosts get destroyed financially: They confuse revenue with profit, gross with net, and total investment with actual cash invested.
Let me show you exactly what I mean using real STR scenarios:
📱 SCENARIO A: The Instagram Host's Math
🏠 Property Purchase: $350,000
💰 Monthly Revenue: $6,500
📊 Annual Revenue: $78,000
📈 "ROI": 22.3% ($78,000 ÷ $350,000)

Instagram Post: "22% ROI on my latest property! 🏠💰"
🧮 SCENARIO B: Mathematical Reality
💵 THE INVESTMENT:
Property Purchase:          $350,000
Down Payment (20%):        $70,000
Actual Investment:         $70,000
📊 MONTHLY CASH FLOW ANALYSIS:
Monthly Revenue:                        $6,500

Monthly Expenses:
• Mortgage                              $1,890
• Insurance                             $350
• Property Tax                          $580
• Maintenance                           $650
• Management (7%)                       $455
• Utilities                             $180
• Cleaning                              $780
• Supplies                              $120
                                        ──────
Total Expenses:                         $5,005

Net Monthly Cash Flow:                  $1,495
🎯 THE REAL NUMBERS:
Annual Net Cash Flow = $17,940
Actual ROI = $17,940 ÷ $70,000 = 25.6%
Same property. Same revenue. Different understanding of mathematical relationships. Completely different business decision.
The Instagram host thinks they made a good investment based on revenue-to-purchase-price ratio. The mathematically literate host knows they made a GREAT investment based on cash-on-cash return.
"The essence of mathematics is not to make simple things complicated, but to make complicated things simple." - Stanley Gudder
But here's where it gets dangerous:
The Instagram host might buy 4 more "22% ROI" properties without understanding leverage, debt service coverage, or cash flow requirements. They'll be overleveraged and cash-poor within 18 months.
The mathematically literate host understands the difference between gross yields and net returns, between revenue metrics and profitability metrics. They'll scale sustainably and build real wealth.
Ready to stop guessing and start calculating your true STR profitability? Schedule your strategy session now and I'll show you exactly how to apply these mathematical principles to your specific portfolio.
Month-by-Month: How Mathematical Precision Compounds STR Wealth
Let me show you exactly how proper STR mathematics works versus the fantasy numbers most hosts use:
🏠 PROPERTY SPECS: Austin, Texas Case Study
Property Type:          3BR/2BA
Purchase Price:         $420,000
Down Payment:           $84,000
Loan Amount:            $336,000
Interest Rate:          6.5% for 30 years
Monthly Mortgage:       $2,124
📊 6-MONTH PERFORMANCE ANALYSIS
💰 MONTH-BY-MONTH BREAKDOWN:
Month    Nights    Revenue    Expenses    Cash Flow
───────────────────────────────────────────────────
Month 1    24      $7,200     $4,878      $2,322
Month 2    23      $6,900     $4,827      $2,073
Month 3    27      $8,100     $5,031      $3,069
Month 4    25      $7,500     $4,929      $2,571
Month 5    26      $7,800     $4,980      $2,820
Month 6    28      $8,400     $5,082      $3,318
🎯 6-MONTH TOTALS:
Total Revenue: $45,900
Total Expenses: $29,725
Total Net Cash Flow: $16,175
Average Monthly Cash Flow: $2,696
Annualized Cash Flow: $32,349
Cash-on-Cash ROI: 38.5%
🚫 TYPICAL HOST'S "ANALYSIS" (The Fantasy Version)
Month 1: "Made $7,200!" (Ignores $4,878 in expenses)
Month 2: "Made $6,900!" (Ignores $4,827 in expenses)
Month 3: "Made $8,100!" (Ignores $5,031 in expenses)

"Total Profit": $45,900
"ROI": 10.9% ($45,900 ÷ $420,000)

Result: Host thinks they're underperforming
Reality: They're crushing market returns
🎯 THE MATHEMATICAL ADVANTAGE:
✅ MATHEMATICALLY PRECISE HOST KNOWS:
True ROI: 38.5%
Monthly cash flow requirements: $2,696 average
Break-even occupancy: 17.7 nights at $300
Scaling potential: Can support another property in 7 months
❌ TYPICAL HOST HAS NO IDEA:
If they're profitable
What their true returns are
Whether they should buy another property or sell this one
🚀 COMPOUND IMPACT OVER 12 MONTHS:
Host Type                Strategy                     Month 12 Cash Flow
─────────────────────────────────────────────────────────────────────────
Mathematically Precise  Data-driven scaling,         $5,392/month
                        acquires 2nd property
                        in month 8

Typical Host            Still guessing, no clear      $2,696/month
                        strategy, owns one property

Monthly Difference:                                   +$2,696
Annual Difference:                                    +$32,352
The mathematical precision creates a $2,696 monthly difference within 12 months.
Over 5 years? The mathematically precise host has a portfolio generating $175,000+ annually. The typical host is still confused about whether their single property is profitable.
Stop Lying to Yourself: STR Math Is Life or Death
This isn't a matter of opinion. Mathematics is a science, and science deals in absolute truths about your STR business.
⚖️ THE MATHEMATICAL LAWS THAT GOVERN STR PROFITABILITY:
1️⃣ PROFIT EQUATION:
Revenue - ALL Expenses = Profit
(Not revenue minus some expenses)
2️⃣ ROI CALCULATION:
ROI = Annual Profit ÷ Actual Cash Invested
(Not total property value)
3️⃣ OCCUPANCY RATE:
Occupancy = Nights Booked ÷ Nights Available
(Not bookings divided by days)
4️⃣ COMPOUND GROWTH:
Future Value = Present Value × (1 + Growth Rate)ⁿ
(Not when you "reinvest" in lifestyle inflation)
According to STR industry data, hosts who track these mathematical fundamentals achieve 73% higher returns than those who use "gut feeling" and simplified calculations.
🎯 WHAT THIS MEANS FOR YOUR STR BUSINESS:
Every pricing decision, every property acquisition, every expense allocation needs mathematical verification. Not gut feeling. Mathematical verification.
Because the difference between mathematical literacy and mathematical ignorance in STR is measured in six figures annually.
✅ Mathematically literate hosts: Build generational wealth through compound cash flow
❌ Mathematical guessers: Stay broke with expensive hobbies
Your STR Empire Dies Here (Unless You Learn These 6 Skills)
Let me be crystal clear about what's at stake in the short-term rental industry:
🚨 IF YOU CAN'T DO THESE 6 MATHEMATICAL OPERATIONS CONFIDENTLY:
📊 THE NON-NEGOTIABLE SKILLS:
Cash Flow Analysis →
Revenue - ALL Expenses = ProfitROI Calculations →
Annual Profit ÷ Actual InvestmentOccupancy Mathematics →
Nights Booked ÷ Nights AvailableDynamic Pricing Formulas →
Cost + Profit Margin + Market AdjustmentCompound Growth Projections →
Current Cash Flow × Growth Rate × TimeExit Strategy Analysis →
Hold vs. Sell mathematical comparison
⚠️ THE CONSEQUENCES:
YOU WILL LOSE MONEY.
EVERY MONTH.
UNTIL YOU EITHER LEARN MATH OR QUIT THE BUSINESS.
"In mathematics you don't understand things. You just get used to them." - John von Neumann
Industry research shows that 67% of STR hosts who can't perform these calculations accurately exit the business within 2 years. Not because STR doesn't work. Because they never understood the mathematical relationships that make it work.
📈 THE GOOD NEWS:
You can learn these skills. They're not advanced mathematics. They're practical tools that every STR host should master.
📉 THE BAD NEWS:
Most hosts won't. They'll continue believing that "good locations" and "nice photos" determine profitability. They'll keep guessing at pricing, ignoring true expenses, and scaling based on emotions instead of mathematics.
And they'll pay for that ignorance with every property they buy, every guest they host, and every business decision they make.
Don't be most hosts.
Get your strategy session here and I'll show you exactly how to apply mathematical precision to your STR portfolio. Because successful STR hosting isn't about hospitality skills or marketing genius.
It's about mathematical literacy applied to real estate investment. And mastering the math means mastering the money.
Period.
J. Massey
Host of the Cash Flow Diary Podcast | STR Investment Strategist | Mathematical Literacy Advocate